The 614cast
Monday tl;dr
🌦️ Partly cloudy with spotty storms, high in the mid-80s.

Forecast highlights
😩 Still warm, still humid
After spending most of last week in Michigan (no, I’m not going to cross out the “M” or call it “the state up north” or anything like that… sorry not sorry), I got used to comfortable weather. Alas, we didn’t bring the pleasant conditions back with us. We’ll have highs between about 85 and 90 all week, along with tropical dew points. Mornings will only drop to the lower 70s. Yuck.
This Reddit thread, despite having a slightly inaccurate assessment in the title, gets to the core of the issue of this summer’s warmth. Yes, we’ve had only a few below-average highs over the past month, but the mornings have been especially not-refreshing.
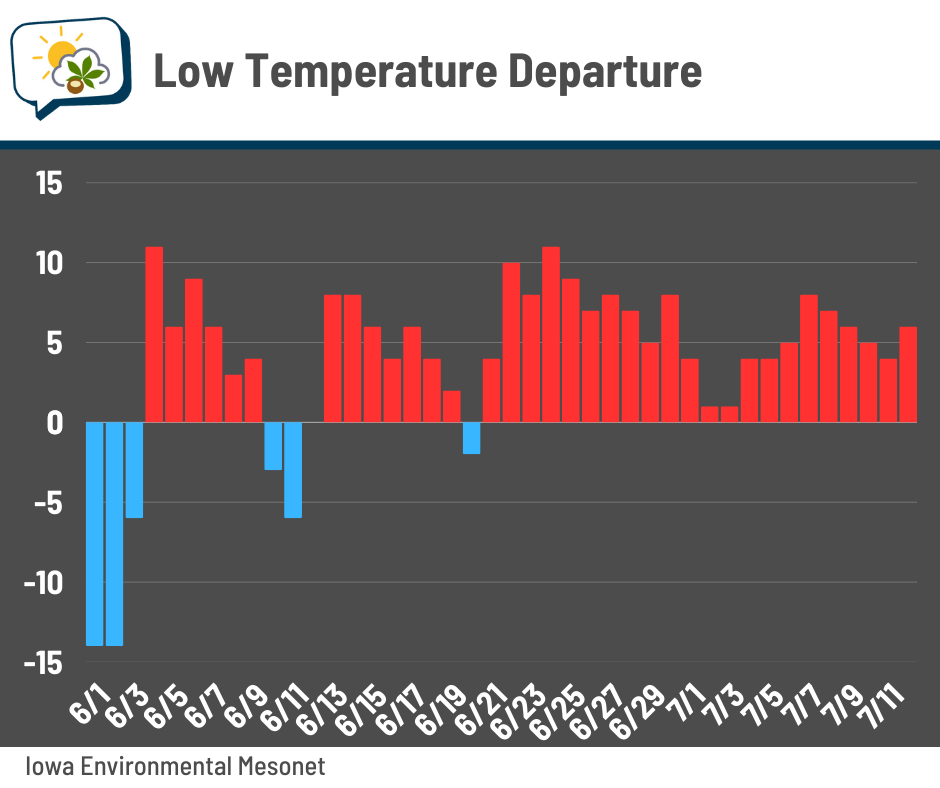
Here’s how the full numbers shake out over the past month (through July 12, since Sunday’s numbers won’t be out until after I’ve written this):
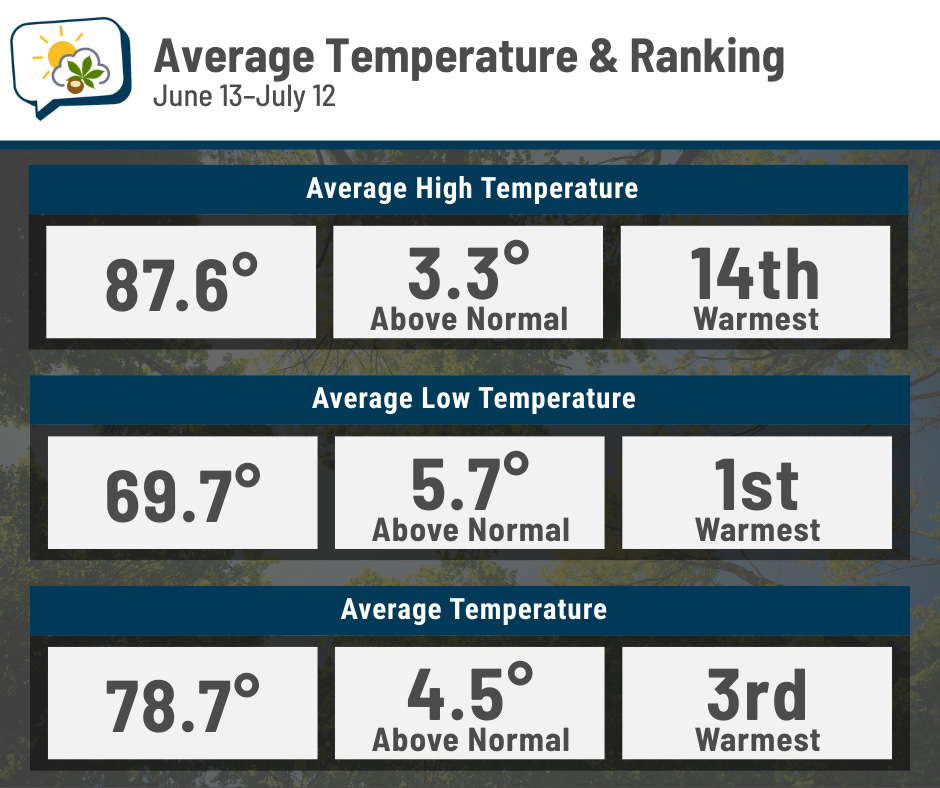
Season-to-date since June 1 has a similar flavor. The average high is 21st warmest and the average low ranks #2.
🍿 Popcorn storms
A stalled front is draped across the region and will be the focus for occasional scattered showers and storms over the next few days. These aren’t the all-day-every-day variety… we’ll have many dry hours. In general, the afternoons and evenings will probably have increased coverage of disorganized storms popping up compared to the mornings thanks to the heating of the day. However, the timing of little disturbances rippling along the front will also dictate when we see stuff flare up.
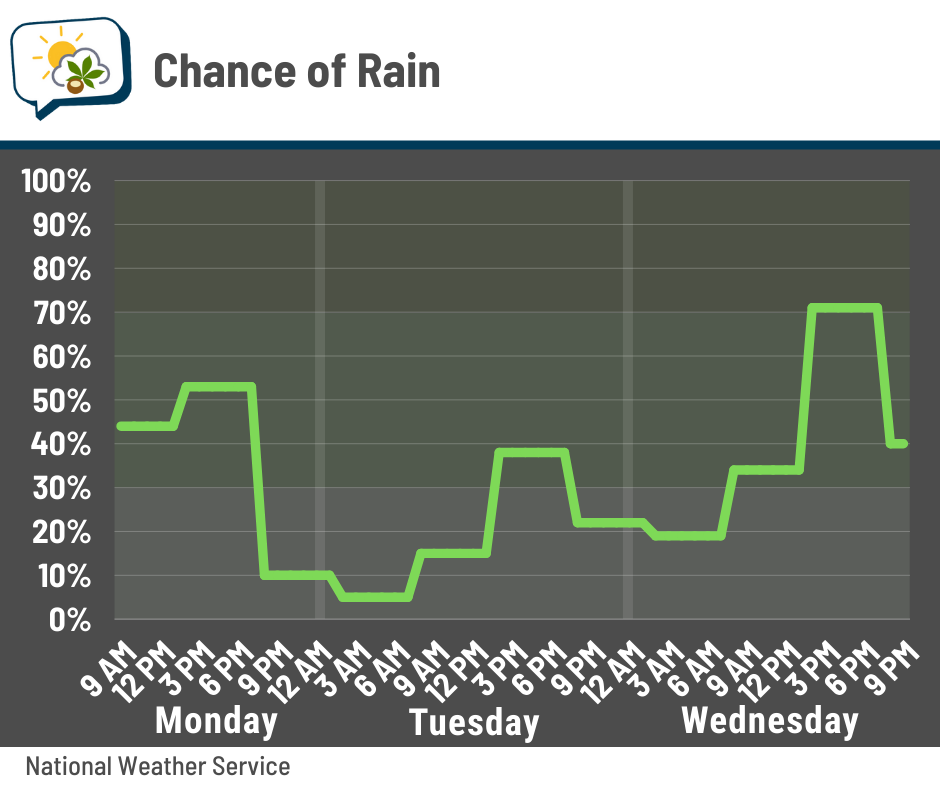
Severe weather is not likely, but local downpours over an inch are possible since there’s not much wind aloft to steer storms along. They’ll be pretty efficient at wringing out the plentiful moisture we have sitting around.
📊 Today’s almanac
Normal low/high: 66 / 86
Record low/high: 47 (1950) / 106 (1936)
Sunrise/set: 6:15 a.m. / 9:00 p.m. (This is the last 9 p.m. sunset until June 10, 2026)
🧊 Cooling degree days
“Degree days” are a way of measuring how warm or cool a place is over some period of time. They’re useful for giving a benchmark related to energy usage.
In the summertime, we use cooling degree days, because we’re using energy to cool homes or businesses. The common baseline temperature for calculating cooling degree days, or CDDs, is 65. We compare that number to the actual average temperature of the day (high temperature plus low temperature, divided by two) to find out how many CDDs there were.

For example, let’s say the high was 90 and the low was 70. That gives us an average temperature of 80. 80-65=15, so we had 15 CDDs that day.
A variety of factors will determine how much you’ll use your A/C on a given day, but in general, greater CDDs means more energy usage. It incorporates not just how warm the afternoon is, but how warm the morning is — and the many warm mornings this summer have certainly kept air conditioners humming more than they otherwise would.
There’s not a direct 1-to-1 correlation between CDDs and energy use, yet some people still have fun examining the data. The EPA also plots kilowatt hours against CDD per decade on page 10 of this doc.
CDDs can be used for more than just nerdy math exercises; there’s a practical use if you want to see how certain cooling-related changes to your home are performing. The National Weather Service explains it well:
Without degree days, comparing the energy used over two periods would be analogous to calculating the miles per gallon rating for your car without knowing how far you had driven. If you wanted to know if the attic insulation you added over the summer was saving energy, you would use your energy bills to determine how much “fuel” was used before and after the retrofit. Then, using the degree days, you could determine “how far you went” during those periods.
Here’s how many CDDs have happened in Columbus so far this year. We’re way above average and have moved well into the top 25%.

And yes, the cold season has its own version called warming degree days. It also uses a baseline of 65.
🌭 Bonus weather weenie content
-
Summer nights are lit this year with a good firefly crop (Axios)
-
Where to find information about flood risk to your home (NPR)
-
Beat the heat with these cooling gadgets and wearables (Associated Press)