The 614cast
Today’s tl;dr
☀️ Mainly sunny, high in the middle 80s.

Forecast highlights
😴 Same old, same old
Holy cats, is this weather boring.
Since I had a TV gig for over a decade, I couldn’t just do 30 seconds of weather during stretches like this and call it good… I still had to craft a narrative that offered something to fill three minutes of airtime. That’s trained me for very uneventful weather patterns like this one; gotta be creative and dig around, but there’s stuff there!
Like this:
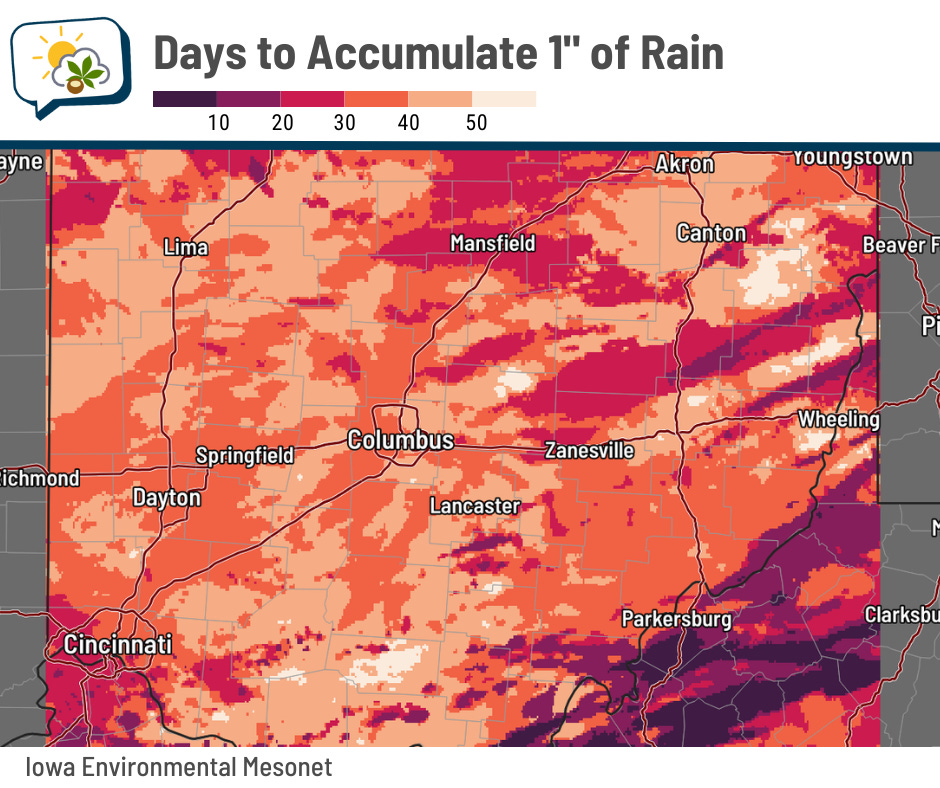
This map is trying to answer the question of “if I were to go back in time day-by-day and add up each day’s rain, how many days would it take for me to collect one inch?”
For much of central Ohio, that number is easily at least 30 days. A pretty good chunk of Franklin County even requires 40-plus days to accumulate one inch of rain.
All right, enough about the past. What are our rain prospects in the near future?

There are still signs of rainfall potential early next week, probably at least four days away. And if we do get rain, it still doesn’t look like it’ll be much.
This is the National Blend of Models’ odds of getting at least a quarter-inch of rain in the 72 hours between Sunday morning and Wednesday morning:
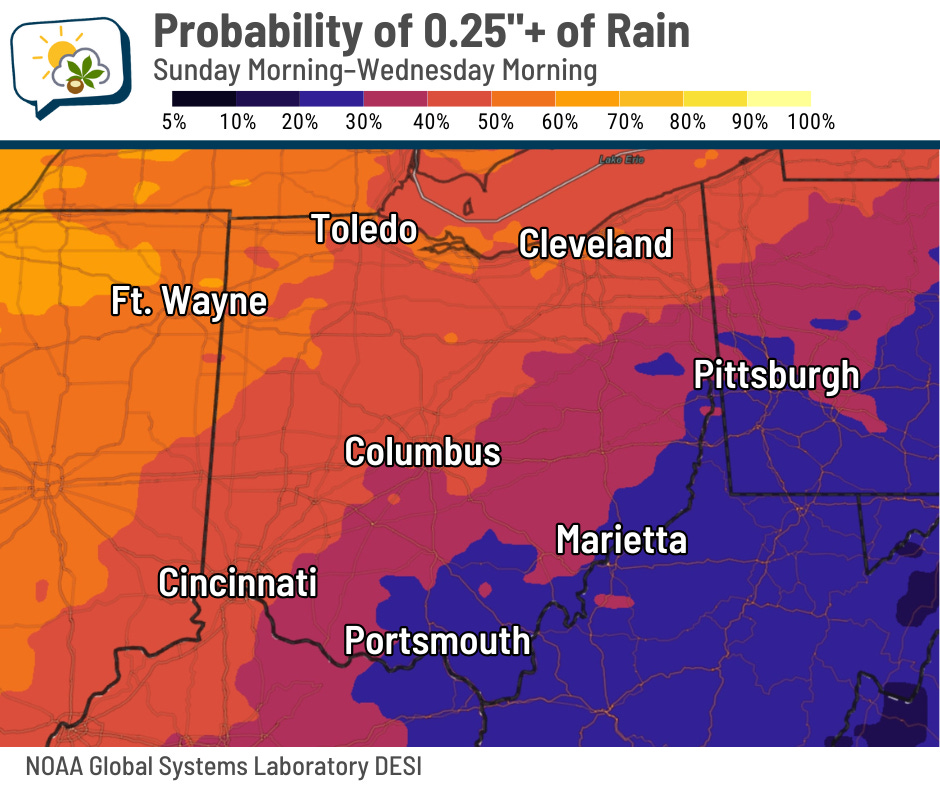
About 30%. Not terrible, considering it’s a little ways off yet, but also not great. We’ll see how those probabilities shift in the coming days.
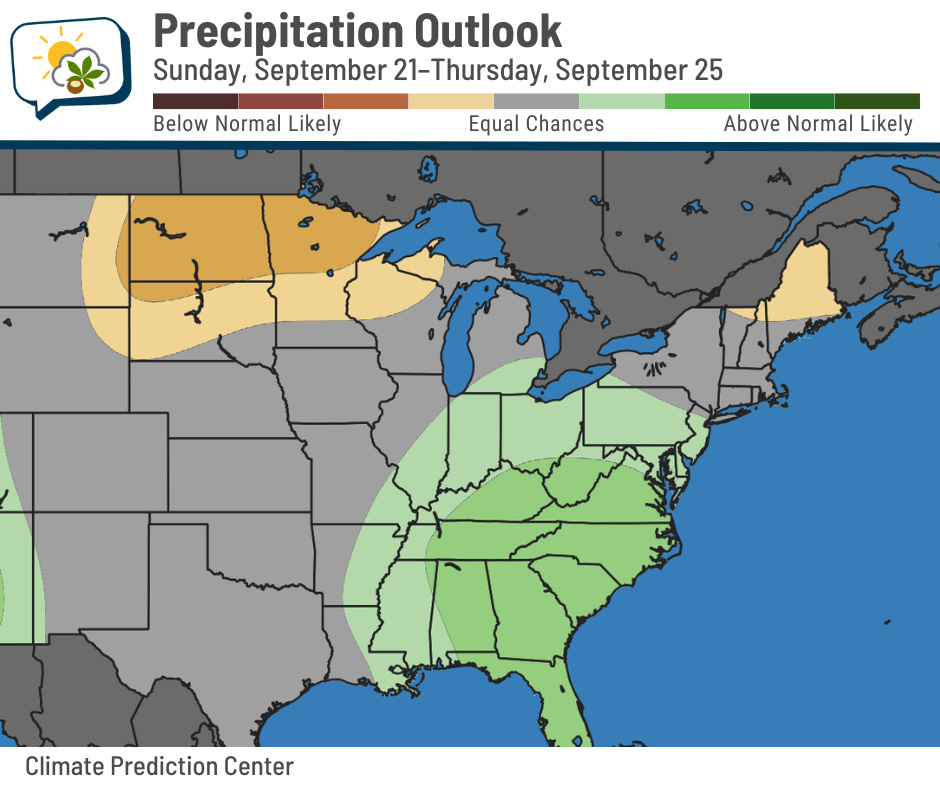
The Climate Prediction Center outlook has odds leaning toward above-average rainfall next week, but the chances break down to 39% chance above normal/33% chance near normal/29% chance below normal.
And lest you think I forgot about temperatures… fall weather isn’t returning anytime soon.
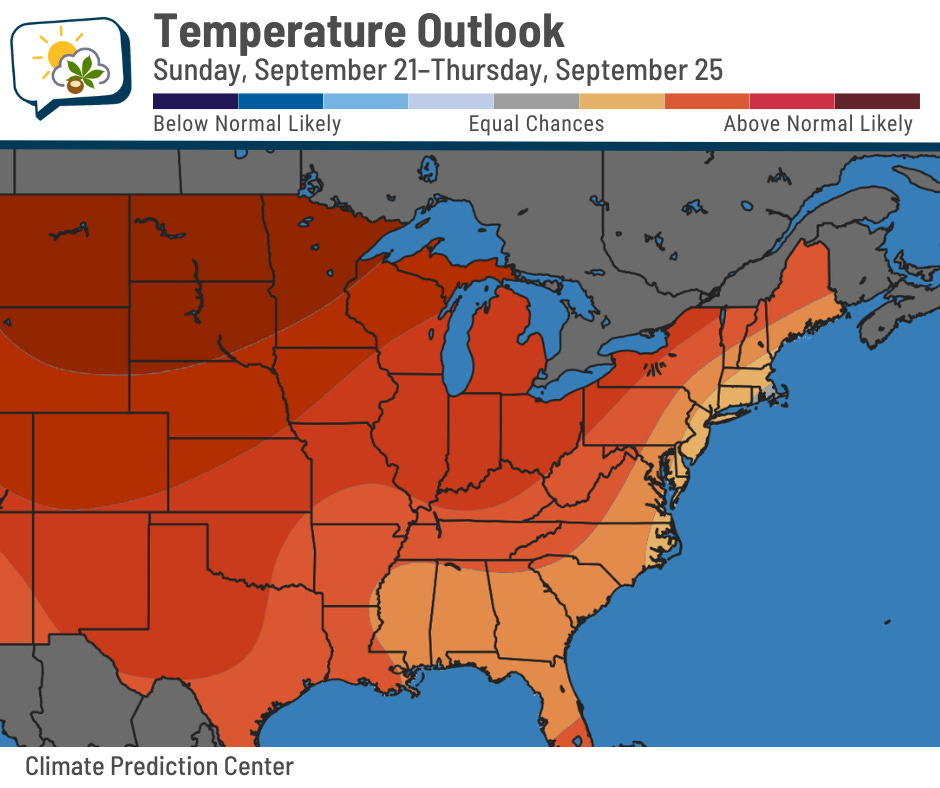
I would be remiss if I didn’t add important context, though. Our normal high continues to fall and is 75–76 next week, so even 80 degrees is considered relatively warm. We’ve entered the time of year when “warmer than average” does not necessarily mean “omg it’s so hot.”
📊 Today’s almanac
Normal low/high: 56 / 78
Record low/high: 37 (1959) / 94 (1955)
Sunrise/set: 7:15 a.m. / 7:36 p.m.
🛰️ Satellite shows the changing landscape
Weather satellites are constantly surveying the Earth, tracking moisture and weather systems and all sorts of other things.
But they also have something to offer on clear days.
Here’s the view from August 12 and September 14, alternating between the two. (You might have to tap/click the image for it to properly load.)
You can see the lush greens fade to browns. That transition is typical as crops begin drying out, although a cursory look suggests that this year and last year were browner at this point compared to other recent years. You can blame dry conditions for that.
I’ll plan on sharing another comparison in about a month to show the progression of fall foliage.
🌭 For the weather weenies
-
Helene in Southern Appalachia | One year later: An event analysis and how we move forward (NOAA National Centers for Environmental Information)
-
Why do wind turbines have three blades? (MinutePhysics/YouTube)